Designing
the best:
An analysis of components that make up
award-winning newspaper pages

Newspaper design has had many different shifts over the years, and has focused on the different dynamics between a variety of components, including image size, headline size, white space and the number of photos. As designers try to find the best way to present stories in the paper, methods for laying out pages have evolved.

This research looks at the past year (2017) of news design, and the qualities that make up award-winning newspaper pages, and it will give an overview of the similarities and differences between the different sections.

Overall results

Overall, 495 award-winning pages were coded. Of the 495 pages, there were 18 countries represented and four different sections.

On average, the dominant media is 49.20 percent of the page, the dominant headline is 3.96 percent of the page, 60.41 percent of the page is white space, and there are an average of 6.72 images per page. These percentages add up to more than 100 percent because on some pages, the headline is on top of the photo or the photo counts as some of the white space, which causes some pixels to be double or triple counted.

A sample page that shows how large the average dominant image is (49.20%).

A sample page that shows how large the average headline is (3.96%).

A sample page that shows the average number of photographs on a page (6.72).

A page that shows the average amount of white space on a page (60.41%).

Section results

Results were also calculated based on what section of the newspaper the pages were a part of. The sports section had the largest dominant images (54.73%), opinions had the largest headlines (5.28%) and the most white space (66.51%) and sports had the most images per page (9.68).

On the other side, the news section had the smallest dominant images (44.53%), sports had the smallest headlines (3.17%) and the least white space (57.94%) and opinions had the fewest number of images per page (4.19).

News

For the news section, the dominant media was 44.53 percent of the page, the headline was 4.84 percent of the page, white space was 60.1 percent of the page and there were 6.35 images per page.

A sample news page with the average dominant image (44.53%).

A sample news page with the average headline (4.84%).

A sample news page with the average number of photos (6.35).

A sample news page with the average amount of white space (60.1%).

Opinions

For opinions, the dominant image was 49.96 percent of the page, the headline was 5.28 percent of the page, the white space was 66.52 percent of the page and there were 4.19 images per page.

A sample opinions page with the average dominant image size (49.96%).

A sample opinions page with the average headline size (5.28%).

A sample opinions page with the average number of photos (4.19).

A sample opinions page with the average amount of white space (66.51%).

Features

The features section had an average dominant image that was 52.04 percent of the page, an average headline that was 3.41 percent of the page, the white space was 61.74 percent of the page and an average of 5.82 images per page.

A sample features page with the average dominant image (52.04%)

A sample features page with the average headline size (3.41%)

A sample features page with the average number of photos (5.82).

A sample features page with the average amount of white space (61.74%)

Sports

Regarding sports, the dominant image was 54.73 percent of the page, the headline was 3.17 percent of the page, the white space was 57.94 percent of the page and each page had an average of 9.68 images per page.

A sample sports page with the average dominant image (54.73%).

A sample sports page with the average dominant headline (3.17%).

A sample sports page with the average number of photos (9.68).

A sample sports page with the average amount of white space (57.94%).

Dominant imagery

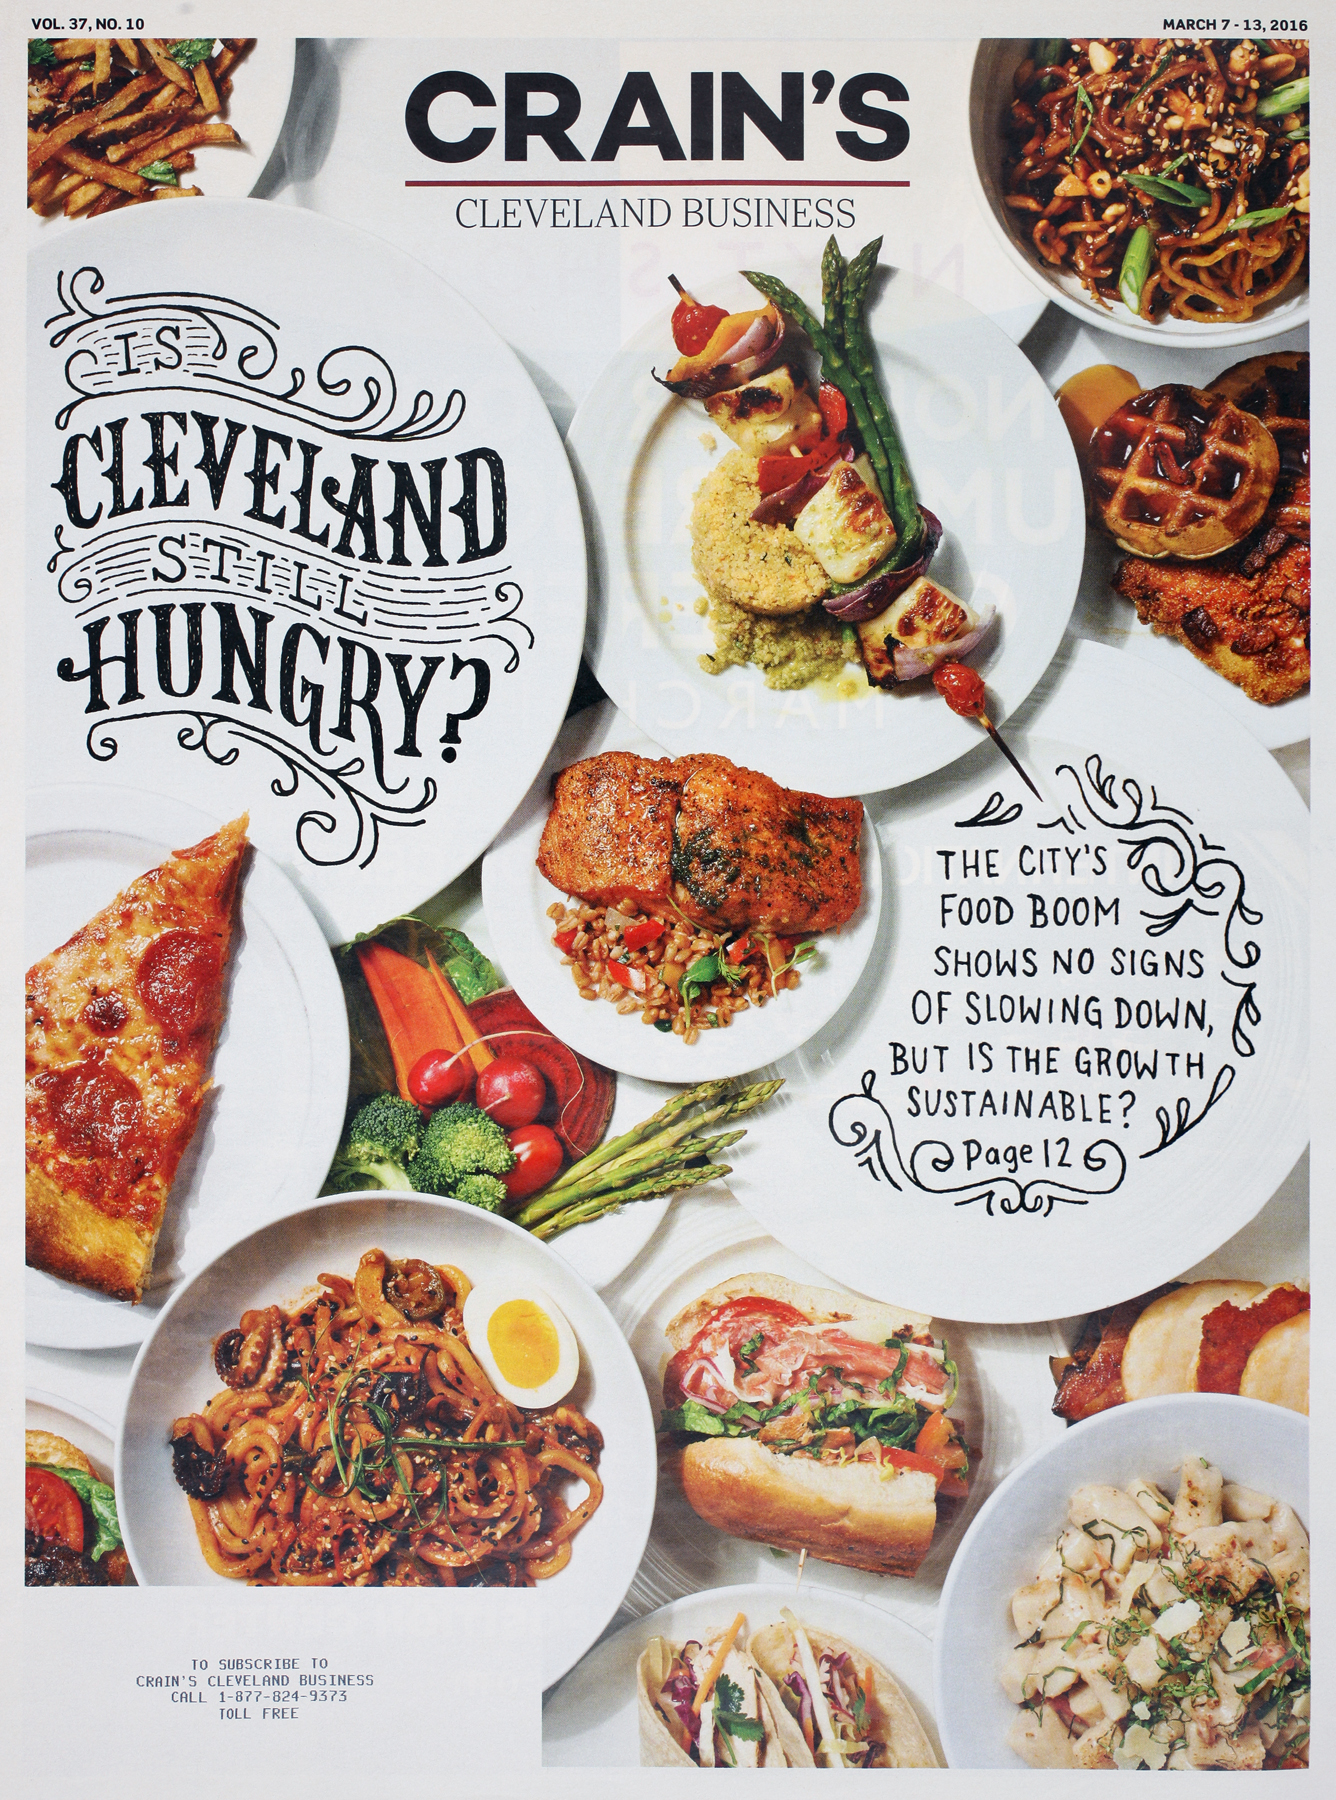
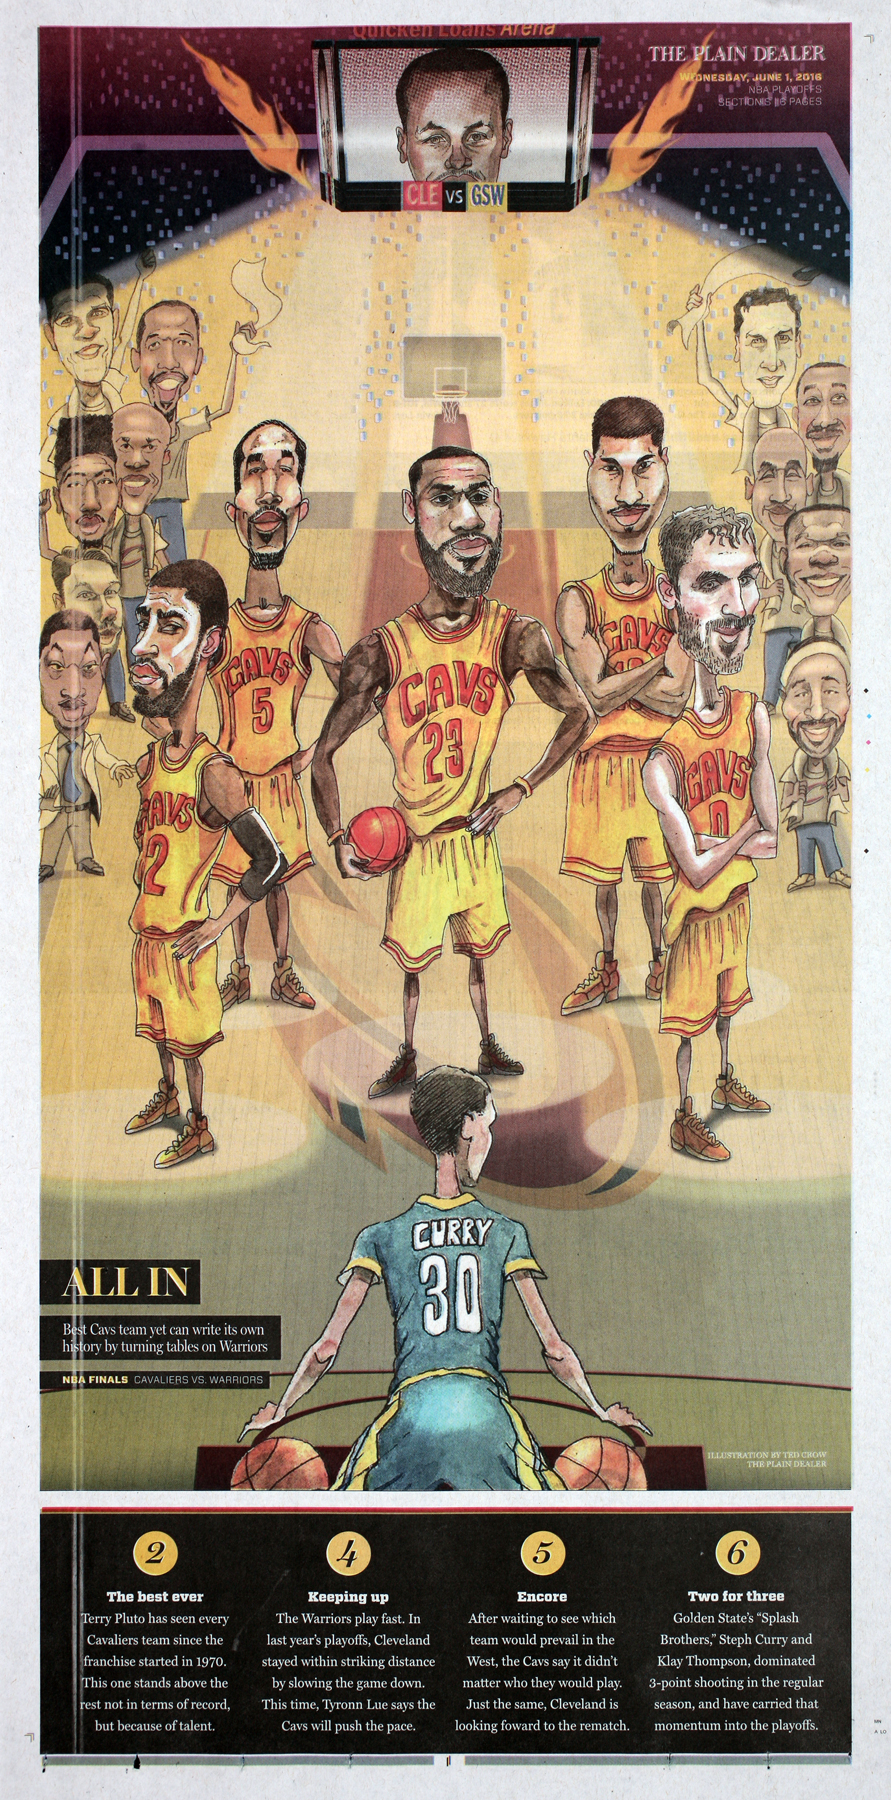
The dominant imagery of the sections also differed. News and sports used photography the most often (60.85% and 55.56% respectively) while opinions and features both used illustration the most (61.29% and 42.31% respectively). Features was also more likely to use a photo illustration than any other section (17.69%) while news was more likely to use infographics than any other section (11.91%).

Number of images versus percent dominant image

There was a trend between the number of images and the size of the dominant image. Pages that had a higher number of images usually had smaller dominant images. The page that had the highest number of images had 201 images, but the dominant image was only .24 percent of the page. The largest image size though was 97.72 percent of the page, and was the only image on the page. There were a few outliers, including a page that had 25 images on it and had a dominant image size of 92.13 percent, which may be explained by having one very large image, with smaller image on top of it.

Conclusion

The findings from this study highlight what the main components of award-winning news design are and how they vary across section and country. Overall, dominant images on pages tend to take up around half of the page, while headlines are very small and only around 4 percent of each page. White space is approximately 60 percent of each page, and there’s an average of 6.72 images per page.

A limitation of this study is that white space was calculated by determining which pixels were below 50 percent black when converted to grayscale, which isn’t necessarily the most effective way to measure purposeful white space on a page.

Additional studies could focus solely on white space with a more intricate methodology focused on breaking down purposefully added white space that ignores the typical leading and margins of a newspaper. This would give a more detailed look at how papers typically employ white space, whether that be around photos, headlines or body copy to make particular items jump out to the reader.

Another study could look at additional award-winning designs over the course of multiple years to chart the changes in design components and see how things have changed over time. This could be done in either consecutive years, or every five or ten years depending on what time frame is being analyzed.

Because there is so little research done regarding award-winning news design, there is plenty of additional research that can be done to further the investigate what makes a particularly compelling, unique and interesting page.